Overview: GBP/USD has been entrenched in a downward trend, facing notable challenges as it navigates key support levels. Last week, the pair exhibited considerable volatility, particularly in its interaction with strong support levels. While initially showing resilience, GBP/USD eventually succumbed to downward pressure, breaking below support and closing the week lower. As it rests on a new support level, the pair faces two potential scenarios, each carrying implications for future price action.
Key Events:
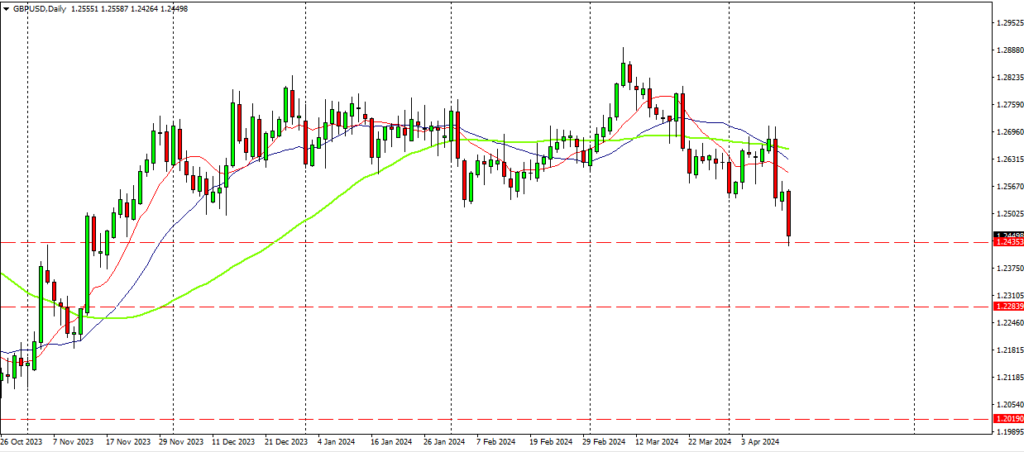
Two levels of resistance below
- Downward Trend: GBP/USD has been in a sustained downtrend, reflecting broader market sentiment and fundamental factors.
- Support Tests: Last week witnessed GBP/USD’s struggle to maintain above crucial support levels. Despite several attempts to break below, the pair managed to recover temporarily until the final day when it decisively breached the support.
- Volatility: The pair exhibited heightened volatility throughout the week, characterized by rapid movements both above and below key levels.
Current Situation:
- New Support Level: GBP/USD currently rests on a fresh support level after breaking below the previous one. This juncture presents a critical point for determining the pair’s next move.
- Potential Scenarios: There are two primary scenarios that could unfold from this point onwards:
- Bounce Back: GBP/USD could find support at the current level and stage a rebound, potentially shifting momentum in favor of the bulls.
- Further Declines: A more likely scenario involves the pair breaking below the new support level and subsequently encountering resistance at two subsequent support levels. This downward trajectory could see GBP/USD targeting 1.20871.
Technical Indicators:
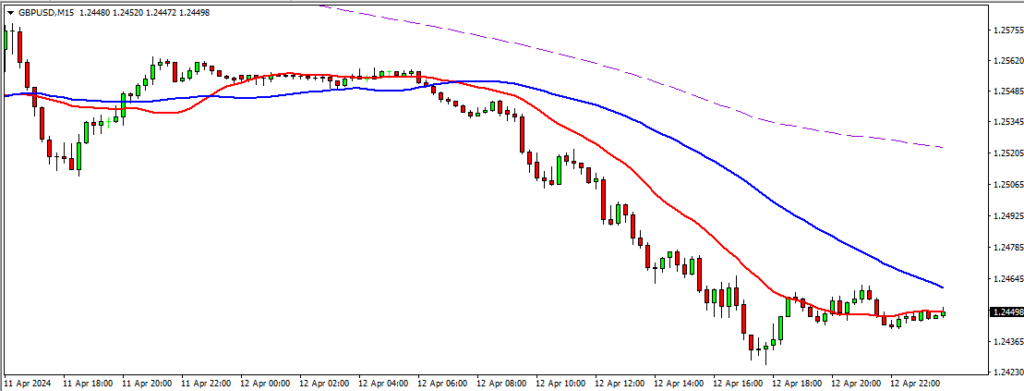
Consistent drop on the last day
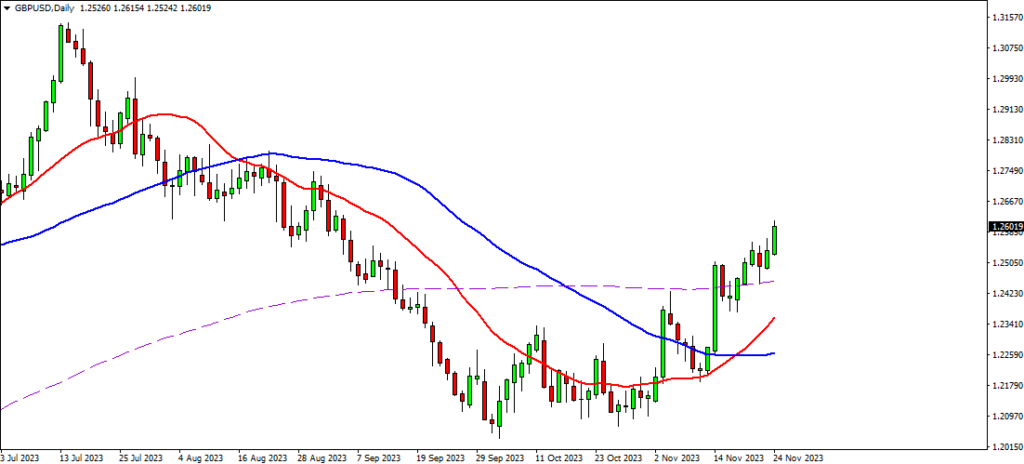
- Moving Averages: The moving averages indicate a bearish sentiment, Like the pair the MA was in steady decline for most of the day. Even after the end of the day bounce the pair rests below 50 MA.
- RSI: The Relative Strength Index (RSI) suggests that GBP/USD is currently slightly above oversold, potentially signaling a short-term reversal. However, this should be interpreted cautiously within the context of the broader downtrend.
Conclusion: GBP/USD faces significant downward pressure as it contends with critical support levels. While the possibility of a bounce-back exists, the more probable scenario entails further declines towards 1.20871. Traders should exercise caution and closely monitor price action around key support and resistance levels to gauge the pair’s next move accurately.
