Categories
GBP/USD

Technical Analysis: GBP/USD Faces Downward Pressure with Potential for Further Declines

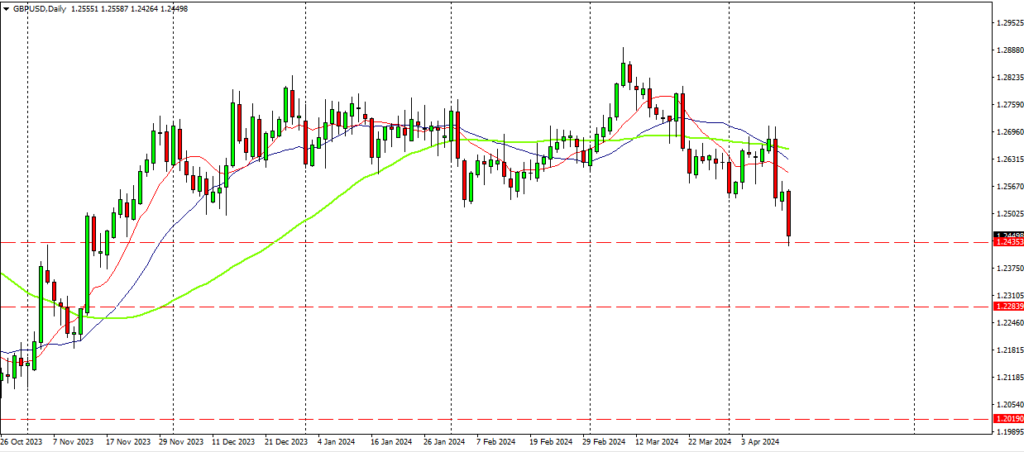
Overview: GBP/USD has been entrenched in a downward trend, facing notable challenges as it navigates key support levels. Last week, the pair exhibited considerable volatility, particularly in its interaction with strong support levels. While initially showing resilience, GBP/USD eventually succumbed to downward pressure, breaking below support and closing the week lower. As it rests on a new support level, the pair faces two potential scenarios, each carrying implications for future price action.

Key Events:

Two levels of resistance below

  • Downward Trend: GBP/USD has been in a sustained downtrend, reflecting broader market sentiment and fundamental factors.
  • Support Tests: Last week witnessed GBP/USD’s struggle to maintain above crucial support levels. Despite several attempts to break below, the pair managed to recover temporarily until the final day when it decisively breached the support.
  • Volatility: The pair exhibited heightened volatility throughout the week, characterized by rapid movements both above and below key levels.

Current Situation:

  • New Support Level: GBP/USD currently rests on a fresh support level after breaking below the previous one. This juncture presents a critical point for determining the pair’s next move.
  • Potential Scenarios: There are two primary scenarios that could unfold from this point onwards:
    1. Bounce Back: GBP/USD could find support at the current level and stage a rebound, potentially shifting momentum in favor of the bulls.
    2. Further Declines: A more likely scenario involves the pair breaking below the new support level and subsequently encountering resistance at two subsequent support levels. This downward trajectory could see GBP/USD targeting 1.20871.

Technical Indicators:

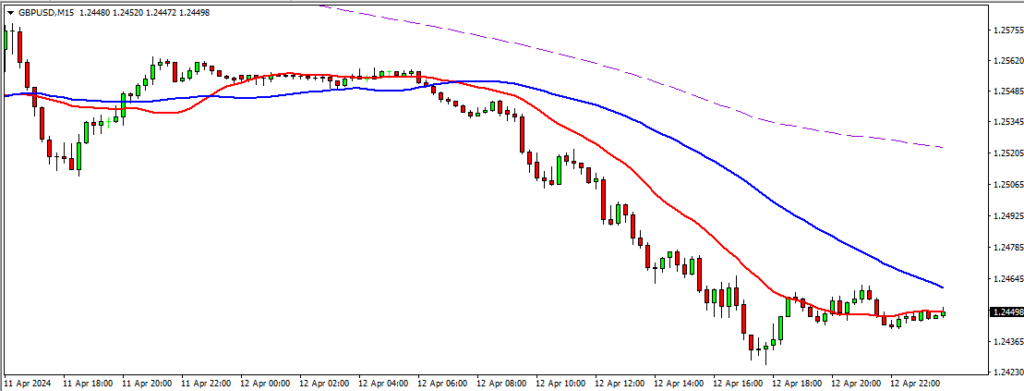
Consistent drop on the last day

  • Moving Averages: The moving averages indicate a bearish sentiment, Like the pair the MA was in steady decline for most of the day. Even after the end of the day bounce the pair rests below 50 MA.
  • RSI: The Relative Strength Index (RSI) suggests that GBP/USD is currently slightly above oversold, potentially signaling a short-term reversal. However, this should be interpreted cautiously within the context of the broader downtrend.

Conclusion: GBP/USD faces significant downward pressure as it contends with critical support levels. While the possibility of a bounce-back exists, the more probable scenario entails further declines towards 1.20871. Traders should exercise caution and closely monitor price action around key support and resistance levels to gauge the pair’s next move accurately.

Categories
Insights

Costco’s stock price hit record high

In the heart of a bustling fiscal quarter, Costco made waves in the financial world by announcing an unexpected venture: gold bars. As the news broke, the corporate landscape buzzed with excitement and speculation. How did a bulk-buy retail giant like Costco find itself in the gold business?

The announcement came during the eagerly anticipated earnings call for the first fiscal quarter of 2024. As the executives began to present the financial highlights, a murmur of surprise rippled through the investor community. Costco had not only surpassed expectations, but it had also achieved a remarkable feat—selling $100 million worth of gold bars.

The company’s Chief Financial Officer, Richard Galanti, shared the news during earnings call. Revealing that the gold bars had become an unexpected hit among their members. When asked about the consumer trend he said “They are buying Gold”.

During the earnings call, Martinez disclosed a 6.1% increase in sales compared to the first quarter of the previous year, showcasing the resilience and adaptability of the retail giant. The surprise didn’t stop there. The company declared a generous $15 per share dividend, further sweetening the deal for investors.

The gold bars, available exclusively to Costco members, quickly became the talk of the town. One ounce of pure 24-karat gold, limited to two bars per person, was now on the shopping list for many savvy investors. The bars were priced at $2069.99 each, making them an attractive addition to the virtual shelves of Costco’s website.

As word spread about the limited-edition gold bars, Costco’s website witnessed a surge in traffic. Members flocked online, eager to get their hands on a piece of the precious metal.

Costco’s shares responded to the unexpected success story with gusto. The stock market witnessed a flurry of activity as investors scrambled to get a piece of the action. Costco’s shares hit a record high of $661.88, marking the high of the day and showcasing the confidence the market had in the retail giant’s unconventional move.

As the closing bell rang, analysts were left in awe of Costco’s ability to innovate and captivate its audience. The unexpected foray into gold had not only diversified the company’s portfolio but had also set a precedent for retail creativity. Costco had once again proven that, whether it’s in the bulk aisle or the gold market, they knew how to capture the attention of their members and investors alike.
Categories
Insights

What is the reason behind Coca Cola’s success?

Coca-Cola’s success can be attributed to several key factors, which have contributed to its status as one of the most recognizable and valuable brands in the world. Here are some of the reasons behind Coca-Cola’s success:

  1. Strong Branding and Marketing: Coca-Cola has invested heavily in building and maintaining a strong brand image. The company’s red and white logo, catchy slogans, and consistent marketing campaigns have helped create a powerful and memorable brand identity.
  2. Global Presence: Coca-Cola has a massive global presence, operating in virtually every country around the world. This extensive distribution network allows the company to reach a wide and diverse consumer base.
  3. Product Innovation: While the core product remains the classic Coca-Cola beverage, the company has successfully introduced new products and variations to cater to changing consumer preferences. This includes diet and zero-calorie options, flavored beverages, and partnerships with other brands.
  4. Effective Distribution System: Coca-Cola has a highly efficient and well-established distribution system. The company’s products are available in a wide range of outlets, from small convenience stores to large supermarkets, ensuring accessibility for consumers.
  5. Consistency in Quality: Coca-Cola has maintained consistent quality in its products over the years. This consistency has helped build trust and loyalty among consumers.
  6. Adaptability to Local Markets: Despite being a global brand, Coca-Cola recognizes the importance of adapting to local tastes and preferences. The company tailors its marketing strategies and product offerings to suit the cultural and regional differences of various markets.
  7. Iconic Advertising: Coca-Cola has produced some of the most memorable and iconic advertising campaigns in the history of marketing. The company’s commercials, print ads, and promotional efforts have often struck an emotional chord with consumers.
  8. Strong Relationships with Bottling Partners: Coca-Cola operates on a franchise model, working closely with a network of independent bottling partners. This allows the company to focus on its core competencies while leveraging the expertise of local partners for distribution and production.
  9. Investment in Research and Development: Coca-Cola invests in research and development to stay ahead of market trends and consumer preferences. This commitment to innovation helps the company introduce new products and stay relevant in a competitive market.
  10. Corporate Social Responsibility: Coca-Cola has implemented various corporate social responsibility (CSR) initiatives, contributing to community development, environmental sustainability, and other social causes. This positive image has resonated well with socially conscious consumers.

It’s important to note that Coca-Cola’s success is the result of a combination of these factors, and the company’s ability to adapt to changing market dynamics and consumer preferences has been crucial in maintaining its leadership in the beverage industry.

Categories
Money and Sports

Ohtani gets $700 Million deal from Dodgers

In a groundbreaking move that is sending shockwaves through the sports world, Shohei Ohtani has inked a monumental deal with the Los Angeles Dodgers, setting a new benchmark in American sports history with a staggering $700 million contract. This historic agreement not only reflects the exceptional talent and versatility of Ohtani but also solidifies his place as a transformative figure in the realm of professional baseball.

A Dual Threat: The Modern-Day Babe Ruth

Often compared to the legendary Babe Ruth, Shohei Ohtani has redefined the expectations of what a baseball player can achieve. His unique ability to both hit home runs with jaw-dropping power and pitch at elite levels has garnered him widespread acclaim as a true dual threat in the modern era. This comparison to Ruth, a baseball icon, speaks volumes about Ohtani’s prowess and impact on the game.

Financial Phenomenon: Ohtani’s Ripple Effect on Sponsorships

Ohtani’s meteoric rise to stardom extends beyond the baseball diamond, significantly impacting the business world. With sponsors including Mitsubishi UFJ Financial Group Inc., Japan Airlines Co., Kose Corp., and Seiko Group Corp., Ohtani has become a sought-after brand ambassador. His association with these esteemed companies has not only elevated his personal brand but has also proven to be a financial boon for his sponsors. Ohtani’s influence has been known to positively impact share prices, showcasing the symbiotic relationship between his on-field success and the financial success of his sponsors.

A Global Icon: Ohtani’s Influence Beyond Borders

Shohei Ohtani’s appeal extends far beyond the borders of the United States. As a Japanese phenom, he has captivated audiences worldwide, bridging the gap between different cultures and showcasing the universal language of baseball. This global recognition has not only expanded the reach of the sport but has also solidified Ohtani’s status as an international sports icon.

The Dodgers’ Strategic Move: Investing in Excellence

The Los Angeles Dodgers’ record-breaking investment in Shohei Ohtani is more than just a financial transaction; it’s a strategic move to secure a player whose impact transcends the boundaries of traditional baseball roles. Ohtani’s presence on the field brings a level of excitement and unpredictability that is a rare commodity in professional sports, making him an invaluable asset to any team.

As the baseball world eagerly anticipates Ohtani’s next chapter with the Dodgers, one thing is certain – his unparalleled talent and global influence will continue to reshape the landscape of American sports for years to come. The $700 million deal is not just a contract; it’s a testament to Shohei Ohtani’s exceptional abilities and the limitless possibilities that lie ahead in his illustrious career.

Categories
Uncategorized

GBP/JPY prediction November 27

Early drop showing the signs of a bearish day. Or will it bounce back and try to break again?

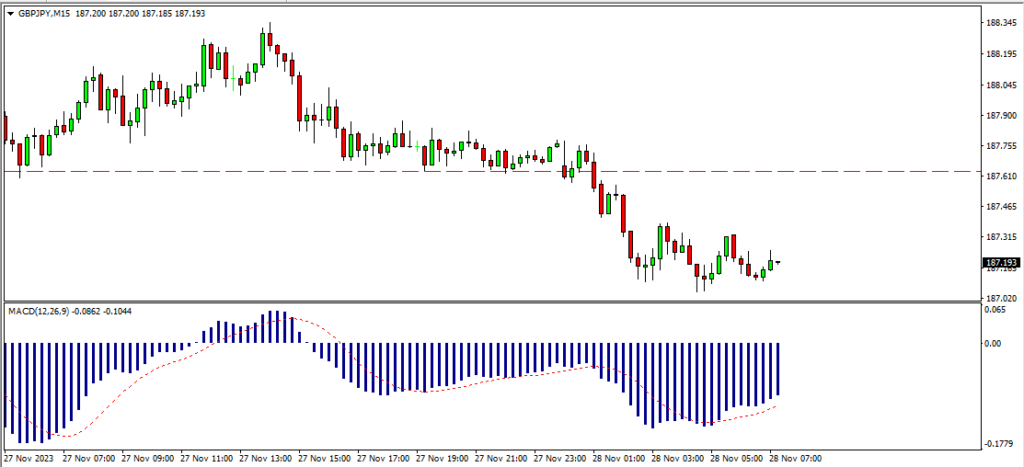
Early drop showing bearish sign

Since we spotted a divergence on 4 hours the pair has dropped more than 100 pips. Call it a successful divergence or just a drop from strong rejection area, bears have been winning so far.

Since the opening today this pair has dropped more than 50 pips. We expect it to bounce back up near the 50 MA and drop again from there. There is a strong support near 186.382. It is now more likely that the pair will travel to that area and bounce back up from there.

So the mood remains bearish unless it truly breaks above 50, then we will look for a buy set up.

Categories
Forecasts GBP/JPY Trading

GBP/JPY result

As anticipated, we had a bearish day. The price tried to head towards the resistance for another attempt but reversed before it reached the top. Fell back to day’s low to settle.

We anticipate another attempt today or even tomorrow if we don’t see a break today. It can end up looking like a consolidation near the top.

So hoping for a break out, but prepared for a drop which might be more likely.

Categories
Forecasts GBP/JPY Trading

GBP/JPY outlook and forecast

Based on price action, on daily, price is trying to break 186.283. Not a complete breakout yet. Last Friday when market closed at this level that was its second failed attempt to break this level in 2 weeks. It might prove to be a strong resistance level. Last time price reached this level was in November 2015.

Second failed attempt to break resistance

On 4 hour chart it just peaking its head out but can very well be a false break.

Looking at RSI on 4 hour chart, it is showing a bearish divergence as the RSi reached just above 70 mark.Coupling with the fact that price is trying to break a tough rsistance area, have to keep a slightly bearish outlook for the day.

Divergence on 4 Hour

Categories
Forecasts GBP/USD Trading

GBP/USD outlook and forecast

Based on price action only, on the daily, the momentum definitely switching to the buying side. After a month of siddeways price action price is taking off. Next strong resistance is around 1.28240. We might see some sort of correction from that level before it breaks.

When you apply RSI to 4 hour chart, it touched the 70 mark, the overbought area. On the chart the nearest resistancce is at 1.26425. If that breaks next one is at 1.27042. Expecting the price to drop from oine of these levels. On the daily 1.26687 can also be alevel on interest.

Bouncing nicely from 200 on daily

Also on the 4hours the price bouncing nicely from 200 ma. On daily it just bounced. So expecting the price to bounce nicely from here. Any dip from resistance might just be a pull back. So buying in the dip is also valid.

Approaching resistance on daily

The MACD is backing up, showing strong bullish momentum.

Categories
Uncategorized

A generic way to detect support and resistance with Python

Detecting support and resistance levels in financial data involves analyzing historical price movements to identify levels at which the price has historically had difficulty moving below (support) or above (resistance). Here’s a basic example of how you can use Python and a popular library like pandas to detect support and resistance levels:

import pandas as pd
import matplotlib.pyplot as plt
import numpy as np
from scipy.signal import argrelextrema

# Load historical price data (you can get this data from a financial API or a CSV file)
# For the sake of example, let's create a simple price dataset
data = {
    'Date': pd.date_range(start='2023-01-01', end='2023-12-31'),
    'Close': [100, 110, 95, 120, 90, 115, 105, 125, 85, 130, 110, 140]
}

df = pd.DataFrame(data)
df.set_index('Date', inplace=True)

# Smooth the data using a moving average to identify significant peaks and troughs
window_size = 3
df['SMA'] = df['Close'].rolling(window=window_size).mean()

# Identify local minima (support levels) and maxima (resistance levels)
minima_idx = argrelextrema(df['SMA'].values, np.less, order=window_size)[0]
maxima_idx = argrelextrema(df['SMA'].values, np.greater, order=window_size)[0]

support_levels = df.iloc[minima_idx]['Close']
resistance_levels = df.iloc[maxima_idx]['Close']

# Plotting
plt.figure(figsize=(10, 6))
plt.plot(df.index, df['Close'], label='Close Price')
plt.plot(df.index, df['SMA'], label=f'SMA ({window_size} periods)')
plt.scatter(support_levels.index, support_levels.values, color='green', label='Support Levels', marker='^')
plt.scatter(resistance_levels.index, resistance_levels.values, color='red', label='Resistance Levels', marker='v')
plt.title('Support and Resistance Levels Detection')
plt.xlabel('Date')
plt.ylabel('Price')
plt.legend()
plt.show()

In this example:

  • We use a simple moving average (SMA) to smooth the price data.
  • We identify local minima and maxima in the smoothed data using argrelextrema from scipy.signal.
  • The identified minima correspond to potential support levels, and the identified maxima correspond to potential resistance levels.
  • We plot the original closing prices along with the smoothed curve and mark the detected support and resistance levels.

This is a basic example, and in a real-world scenario, you might want to use more sophisticated techniques and additional indicators to improve the accuracy of support and resistance level detection. Additionally, you could explore libraries like ta-lib for technical analysis or machine learning models for more advanced pattern recognition.

Categories
Money and Sports

How Formula One (F1) Tems Make Money

Formula 1 (F1) teams generate revenue through a combination of various income streams. The financial structure of F1 teams can be complex, and it involves income from several sources. Here are some of the key ways in which Formula 1 teams make money:

  1. Prize Money:
    • Teams earn prize money based on their performance in races and their position in the Constructors’ Championship. The higher a team finishes in the championship standings, the more prize money it receives. This encourages competitiveness and success.
  2. Championship Bonus:
    • Teams that have a historical significance or have been successful in the past may negotiate additional bonuses with Formula 1 management. This can be based on factors such as the number of championships won or the team’s historical contribution to the sport.
  3. Commercial Sponsorship:
    • Sponsorship is a significant source of revenue for F1 teams. They secure commercial partnerships with companies that want to promote their brands through the global exposure that F1 provides. Sponsors’ logos are prominently displayed on the cars, driver suits, helmets, and team merchandise.
  4. Team Partnerships:
    • In addition to primary sponsors, teams often have partnerships with other companies that provide various services or products. These partnerships can include technology sponsors, logistics partners, and more.
  5. Driver Sponsorship:
    • Drivers themselves often bring sponsorship deals to the team. In some cases, a driver’s personal sponsors may also become team sponsors. The marketability and popularity of a driver can impact the team’s ability to attract sponsors.
  6. Merchandising and Licensing:
    • Teams sell branded merchandise, including team apparel, model cars, and other items, to fans. Licensing deals for the use of team logos and trademarks also contribute to revenue.
  7. Hospitality and VIP Experiences:
    • F1 teams offer hospitality packages and VIP experiences to sponsors, partners, and high-profile guests during race weekends. This can include exclusive access, meet-and-greet opportunities with drivers, and premium seating.
  8. Engine and Technical Partnerships:
    • Teams often enter into partnerships with engine suppliers and technical partners. These agreements can involve financial contributions, technology transfers, or other forms of collaboration.
  9. Broadcasting Revenue:
    • While the bulk of the Formula 1 broadcasting revenue goes to the F1 organization, some agreements may involve revenue-sharing with teams. Teams also benefit from exposure through TV broadcasts, which can attract sponsors.
  10. Performance Bonuses and Incentives:
    • Some contracts between teams and drivers include performance bonuses. These bonuses may be triggered by achievements such as race wins, podium finishes, or specific championship standings.

It’s important to note that the financial landscape of Formula 1 is subject to negotiation, and the details of revenue distribution and team agreements can vary. Teams operate in a competitive environment, and financial success often depends on their on-track performance, marketing strategies, and business negotiations.